How simply can we invest without getting too simple? Three of my largest holdings are multi-cap core funds held in accounts managed by Fidelity, Vanguard, or myself. I own Vanguard Total Stock Market Index ETF (VTI), Fidelity Strategic Advisers US Total Stock (FCTDX), and Vanguard Tax-Managed Capital Appreciation Admiral (VTCLX). What is under the hood of these funds and how well do they perform compared to the market?
According to the Refinitiv Lipper U.S. Mutual Fund Classifications, multi-cap core funds “by portfolio practice, invest in a variety of market capitalization ranges without concentrating 75% of their equity assets in any one market capitalization range over an extended period of time. Multi-cap core funds typically have average characteristics compared to the S&P SuperComposite 1500 Index.”
We are going to see in this article that the performance of these multi-cap funds varies widely. This article is divided into the following sections:
UNDERSTANDING MULTI-CAP FUNDS
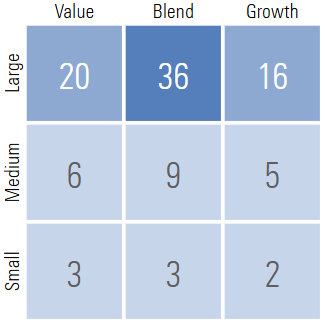
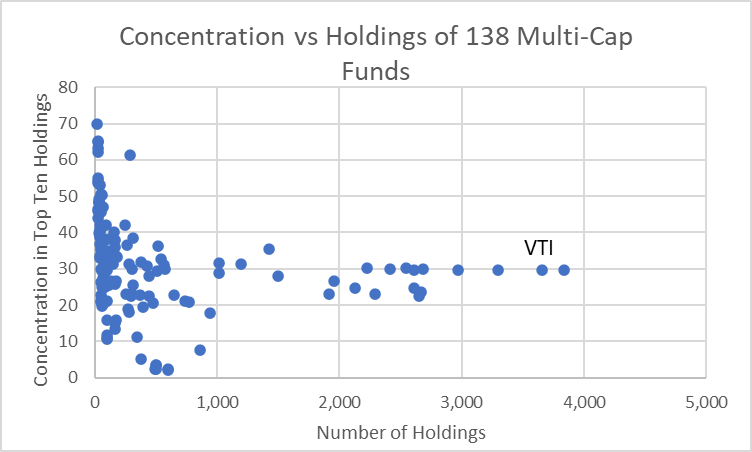
Let’s start with the Vanguard Total Stock Market ETF (VTI) as an example. VTI outperformed 80% of the multi-cap core funds in this study. It holds 3,653 stocks with 30% of its assets in the top ten holdings. The stock style weight according to Morningstar is shown in Table #1.
Table #1: VTI Stock Style Weight
Morningstar gives VTI three stars and a Gold Analyst Rating. According to Morningstar:
“Vanguard Total Stock Market funds offer highly-efficient, well-diversified and accurate exposure to the entire U.S. stock market, while charging rock-bottom fees—a recipe for success over the long run.
The funds track the CRSP US Total Market Index, which represents approximately 100% of the investable U.S. opportunity set. The index weights constituents by market cap after applying liquidity and investability screens to ensure the index is easier to track.”
I selected a large sample (138) of Multi-Cap funds excluding those that use a “fund of funds strategy”. The concentration in the top ten holdings is shown versus the number of holdings in Figure #1. There are only a couple dozen funds that follow a true total market approach.
Figure #1: Multi-Cap Core Fund Concentration Versus Number of Holdings
I used the Mutual Fund Observer Multi-Search Tool to summarize the “Benchmark Best Fit” in Table #2. The benchmark, number of holdings, and concentration will explain a lot of the performance variance. In addition, the median concentration in the US is 95%, while about 15% of the multi-cap core funds have more than 15% invested outside of the US.
Table #2: Multi-Cap Core Fund Best Fit Benchmark, Concentration, Holdings
UNIVERSE OF MULTI-CAP CORE FUNDS
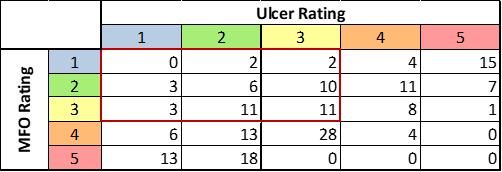
There are 222 multi-cap mutual funds and exchange traded funds that are five years old or older. I selected 176 (79%) US Equity Multi-Cap No-load Mutual Funds and Exchange Traded Funds that are open to new investors, and have at least fifty million dollars in assets under management. Table #3 shows the funds by Ulcer Rating (a measure of depth and duration of drawdown) and MFO Rating (risk-adjusted return) based on quintiles. The red rectangle represents the 48 (27%) funds that have both average or higher risk-adjusted returns and average or lower risk (Ulcer Index).
Table #3: Multi-Cap Core Funds MFO Rating versus Ulcer Rating (Five Years)
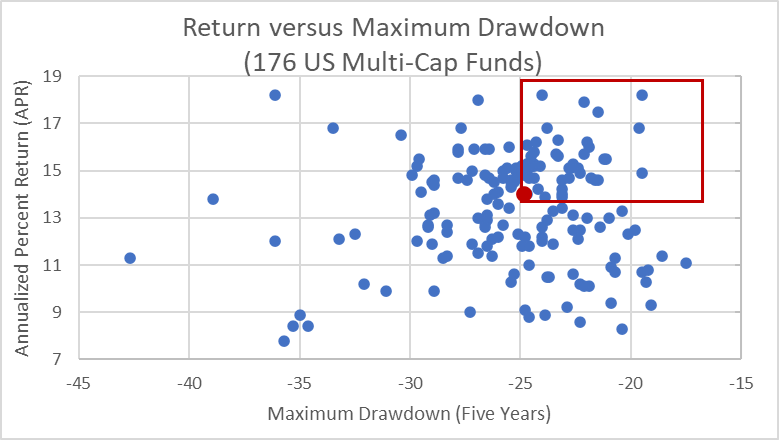
These 176 funds are shown as Annualized Percent Return (APR) versus Maximum Drawdown in Figure #2. Clearly some multi-cap funds significantly outperform others. The mean Annualized Percent Return (APR) over the past five years is 13.5% with 125 (70.6%) lying between 11.2% and 15.8% (within one standard deviation). By comparison, the S&P 500 (SPY) had an APR of 15.9% and a maximum drawdown of 23.9%. The S&P 500 outperformed 87% of the US Equity multi-cap funds partly because large cap growth stocks performed so well over the past five years.
The red symbol in Figure #2 is the median APR and maximum drawdown. The red rectangle represents those funds with above-average APR and below-average drawdowns.
Figure #2: Multi-Cap Core Funds APR Versus Maximum Drawdown (Five Years)
SUMMARY OF TOP PERFORMING MULTI-CAP CORE FUNDS
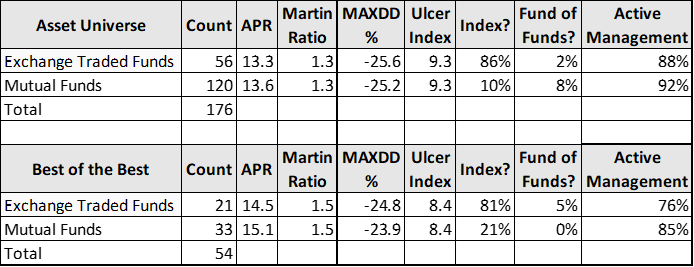
I eliminate funds with Three Alarm Fund Ratings, above-average Ulcer Ratings, and below average APR, MFO Ratings, Lipper Preservation Ratings, and Fund Family Ratings, as well as those with very high minimum required initial investments. This produces fifty-four funds summarized in Table #4. The refined list has a slightly higher APR and Martin Ratio (risk-adjusted return) with a slightly lower maximum drawdown. We can conclude that most of the mutual funds are not index funds and use an active management approach. Most of the exchange traded funds are index funds that use an active management approach.
Table #4: Multi-Cap Core Funds Universe and Best Performing (Five Years)
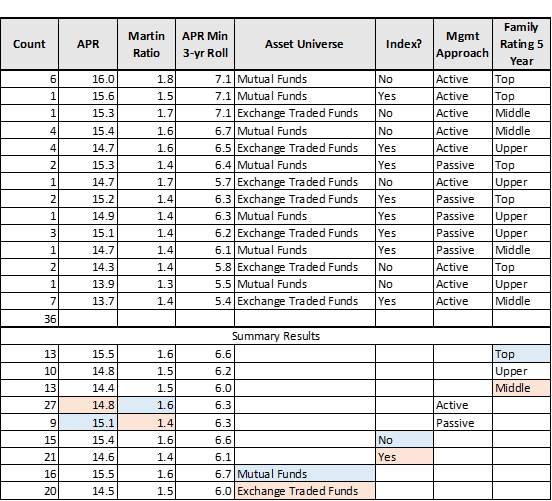
I created a ranking system based on APR, Martin Ratio (risk-adjusted return), and APR Minimum 3-year Rolling average to capture a combination of return, risk-adjusted return, and recovery from downturns. This narrows the list down to thirty-six funds excluding funds that cannot be purchased at either Fidelity or Vanguard without a fee as shown in Table #5. In general, I expect the best funds to be mutual funds that are not indexed and are managed by the Top Fund Families. Passively managed funds tend to have higher returns while actively managed funds tend to have higher risk-adjusted returns.
Table #5: Multi-Cap Core Fund Performance and Approach (Five Years)
TWELVE TOP PERFORMING MULTI-CAP CORE FUNDS
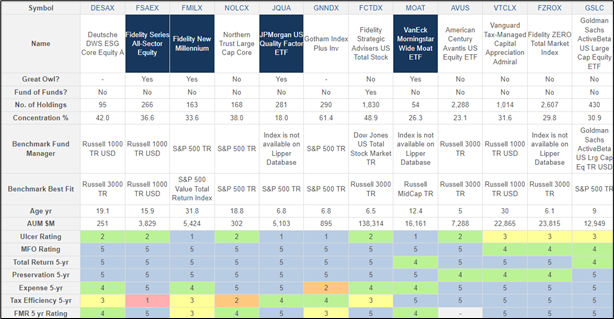
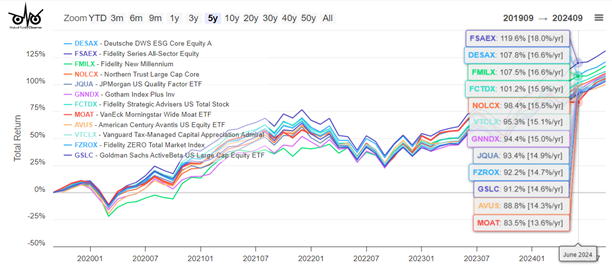
I used my ranking system to select the top-rated funds for APR, Martin Ratio, and APR Minimum 3-year Rolling average shown in Table #6 and Figure #3. Note that some funds are less tax-efficient than others. FCTDX and VTCLX which I own both show up in my list of top-performing multi-cap funds while VTI does not.
Table #6: Twelve Top Performing Multi-Cap Core Funds (Five Years)
Figure #3: Twelve Top Performing Multi-Cap Core Funds (Five Years)
VALUATIONS MATTER
David Snowball pointed out last month in the Mutual Fund Observer October 2024 Newsletter that there can be secular bear markets that take more than ten years for a traditional 60% stock/40% bond portfolio to recover. Ed Easterling is the founder of Crestmont Research and author of Unexpected Returns: Understanding Secular Stock Market Cycles and Probable Outcomes: Secular Stock Market Insights which look at the relationship of valuations and inflation to these secular bear markets.
There are various methods to survive these periods such as covering living expenses with guaranteed income (pensions, annuities, Social Security), building bond ladders, investing for income, using a Bucket Approach to cover ten or more years of living expenses in short and intermediate buckets, variable withdrawal rates to withdraw more during periods with high returns and cutting back on discretionary spending during years with poor returns. The ultra-wealthy use a strategy of “buy, borrow, die” where they borrow from appreciated assets instead of selling them and benefit from lower taxes and the step-up in basis inheritance laws.
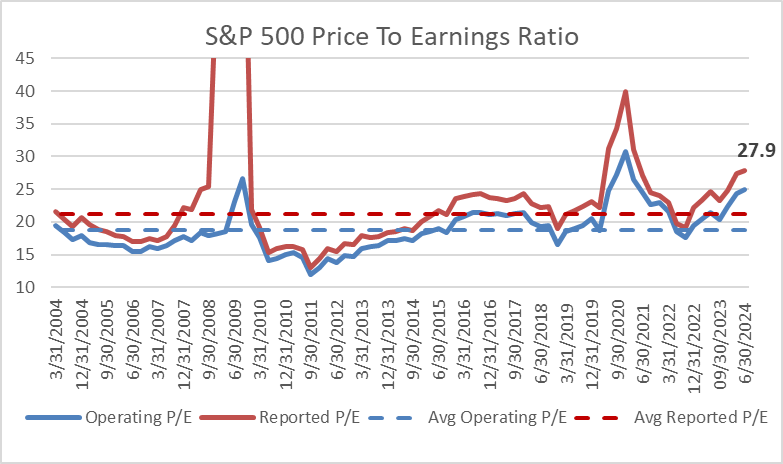
Price-to-earnings ratios seem straightforward, but they can be confusing. I produced Figure #4 from the S&P Global data for Operating and Reported Earnings per share. The dashed lines are the average excluding four quarters during the 2009 financial crisis that distorted the data. The price-to-earnings ratios are over 30% higher than the average of the past twenty years. The timing of the available data can also impact the results. In the following sections, I will compare the price to earnings using Morningstar for funds and the S&P 500.
Figure #4: S&P 500 Price To Earnings Ratio
Ed Easterling’s financial physics describes how inflation and valuations drive secular bear markets. Mr. Easterling normalizes the price-to-earnings ratio for the business cycle and concludes:
Today’s normalized P/E is 40.5; the stock market remains positioned for below-average long-term returns.
The current valuation level of the stock market is above average, and relatively high valuations lead to below-average returns. Further, the valuation level of the stock market is especially high, given the uncertainties associated with the currently elevated inflation rate and interest rate environment…
In this environment, as described in Chapter 10 of Unexpected Returns, investors can take a more active “rowing” approach (i.e., diversified, actively managed investment portfolio) rather than the secular bull market “sailing” approach (i.e., passive, buy-and-hold investment portfolio over-weighted in stocks).
Fidelity invests according to the business cycle as described in How to invest using the business cycle. Vanguard uses a low-cost index strategy but has a time-varying asset allocation approach for its corporate clients. I favor a tilt towards bonds because interest rates and stock valuations are both high.
TAXES MATTER
High national debt has the potential to slow economic growth and raise borrowing costs. The Congressional Budget Office projects that the federal debt held by the public will rise to 122 percent of gross domestic product by 2034 and that economic growth will slow to 1.8 percent in 2026 and later years. To control the national debt, taxes will have to be increased, and/or spending such as Social Security Benefits will have to be reduced in the coming decades.
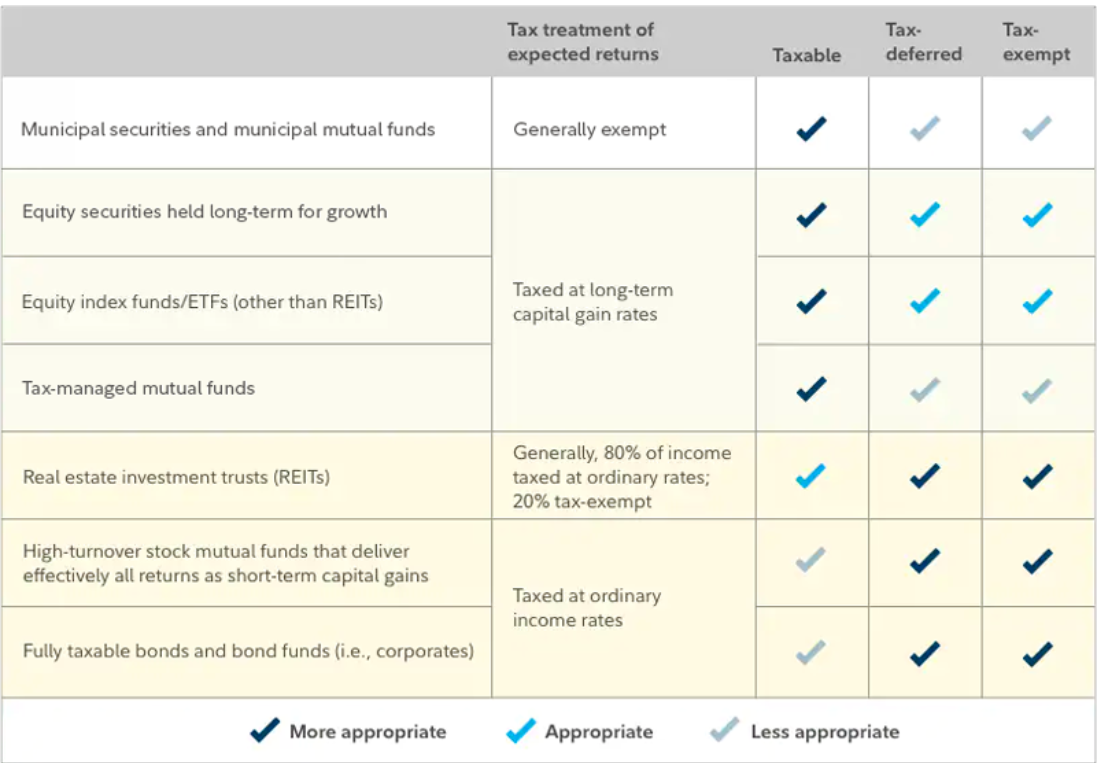
“Are you invested in the right kind of accounts?” by Fidelity Viewpoints describes the types of the types of accounts, and the importance of asset location to minimize taxes. With regard to multi-cap core funds, funds that hold equities for long-term growth, index ETFs, and tax-managed funds are ideal for buy-and-hold taxable accounts. Multi-cap funds with high turnover are better suited for Traditional IRAs and Roth IRAs.
Table #7: Fidelity Asset Location and Tax Characteristics
As part of financial planning, I have diversified across Roth IRAs, Traditional IRAs, and taxable accounts in order to have some flexibility with the uncertainty of future tax changes. Traditional IRAs have required minimum distributions which are taxed as ordinary income while Roth IRAs do not. Accounts that use tax loss harvesting can be used to help manage taxes. I favor Roth IRAs because taxes have already been paid, and earnings grow tax-free. High-growth funds and actively managed funds have the potential to generate more taxable income and tend to be less tax-efficient. Concentrating these funds and higher-risk funds in a Roth IRA is ideal. Tax-efficient multi-cap funds are well-suited for taxable accounts.
AUTHOR’S MULTI-CAP CORE FUNDS
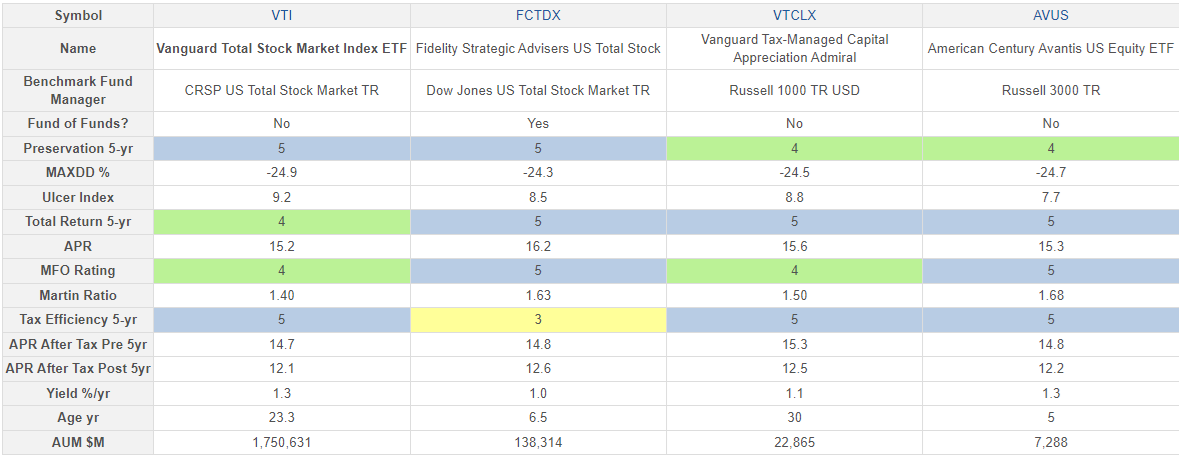
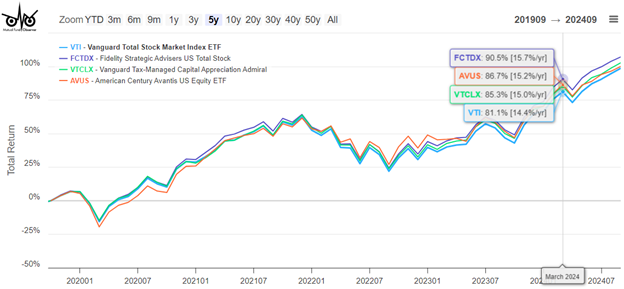
In my professionally managed accounts, Fidelity invests in Fidelity Strategic Advisers US Total Stock (FCTDX) which is only available to clients of Fidelity Wealth Services, and Vanguard invests in Vanguard Total Stock Market Index ETF (VTI) while I invest in Vanguard Tax-Managed Capital Appreciation Admiral (VTCLX) in a self-managed taxable account. I don’t own American Century Avantis US Equity ETF (AVUS) but am interested in the Avantis funds. All four of these funds are top-performing funds.
FCTDX is a fund of funds with high returns but is not especially tax efficient. It is ideal for a Roth IRA. VTI also has high returns and is tax efficient and most suitable for a taxable account, but also fits well in a Traditional IRA or Roth IRA. VTCLX is ideal for a buy-and-hold taxable account.
Table #8: Author’s Multi-Cap Core Funds (Five Years)
Figure #5: Author’s Multi-Cap Core Funds (Five Years)
Strategic Advisers Fidelity U.S. Total Stock Fund (FTCDX)
Strategic Advisers Fidelity U.S. Total Stock Fund (FCTDX) is only available to clients enrolled in Fidelity Wealth Services. It outperformed 94% of the multi-cap core funds in this study. Understanding FCTDX is not particularly straightforward. From the Prospectus, I quote a portion of the “Principal Investment Strategy” that summarizes the FTCDX best for me:
The Adviser pursues a disciplined, benchmark-driven approach to portfolio construction, and monitors and adjusts allocations to underlying funds and sub-advisers as necessary to favor those underlying funds and sub-advisers that the Adviser believes will provide the most favorable outlook for achieving the fund’s investment objective.
When determining how to allocate the fund’s assets among sub-advisers and underlying funds, the Adviser uses proprietary fundamental and quantitative research, considering factors including, but not limited to, performance in different market environments, manager experience and investment style, management company infrastructure, costs, asset size, and portfolio turnover.
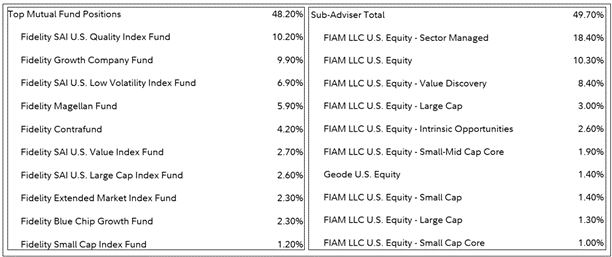
FTCDX is an actively managed fund of funds. Allocations will change according to market conditions. Current allocations are shown in Table #9.
Table #9: FTCDX Top Holdings
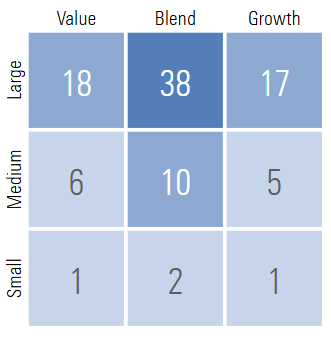
From Morningstar, FCTDX receives four stars and a Gold Analyst Rating. It has a price to earnings ratio of 20.9 compared to 22.3 for VTI, and 22.9 for the S&P 500 (VOO). Stock style weight is shown below:
Table #10: FCTDX Stock Style Weight
Vanguard Tax-Managed Capital Appreciation Admiral (VTCLX)
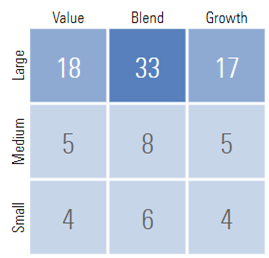
Vanguard Tax-Managed Capital Appreciation Admiral (VTCLX) also receives a four-star rating with a Gold Analyst Rating from Morningstar, “The fund targets stocks that pay lower dividends to enhance its tax efficiency while also mimicking the contours of the flagship Russell 1000 Index, which captures the largest 1,000 US stocks.” Its stock style weights are shown in Table #11. It has a price to earnings ratio of 21.5. It outperformed 86% of the multi-cap core funds in this study.
Table #11: VTCLX Stock Style Weight
CLOSING THOUGHTS
The famous economist, John Maynard Keynes reportedly said in the 1930’s, “The market can remain irrational longer than you can remain solvent.” Mr. Easterling’s books on secular bear markets convinced me early on to maintain a margin of safety in retirement planning. For me, this meant maximizing contributions to employer savings plans, saving more for additional goals, owning a home, living beneath my means, working beyond my normal retirement date, increasing financial literacy, and using a Financial Planner.
As a result of writing this article, I am satisfied that I have top-performing, diversified multi-cap funds that will track or beat the total domestic markets. I am comfortable that these funds are located in the optimum account locations. It also gives me some ideas to research for producing income in Traditional IRAs for when required minimum distributions begin.


