Annual reports often bring to mind spreadsheets and dense financial details, but your nonprofit’s report can be so much more. It’s your chance to communicate your mission’s successes, share compelling stories, and thank those who made it all possible.
A nonprofit annual report isn’t just a collection of financial data—it’s the story of your organization’s impact over the past year. For nonprofit leaders, fundraisers, and marketers, it’s a unique opportunity to deepen supporter engagement by showcasing not just what you did, but why it matters.
So, how can you transform pages of statistics into a compelling narrative that inspires continued support? We’ll explore key strategies to create a nonprofit annual report that informs and motivates supporters:
Let’s make your annual report an inspiring read by making sure it doesn’t just check a box but actually engages your audience.
What is a Nonprofit Annual Report?
A nonprofit annual report is a comprehensive document that provides a detailed overview of a nonprofit’s activities, accomplishments, and financial performance for the previous fiscal year. It’s an impact report that blends data with storytelling, visuals, and financial milestones to convey the impact of the organization’s mission.
When crafted thoughtfully, annual reports build trust with donors, volunteers, partners, and the wider community.
Does a 501(c)(3) Need An Annual Report?
Your nonprofit isn’t legally required to produce an annual report in the same way it must file a Form 990 with the IRS. However, creating an annual report is a best practice.
A well-written annual report leads to these benefits:
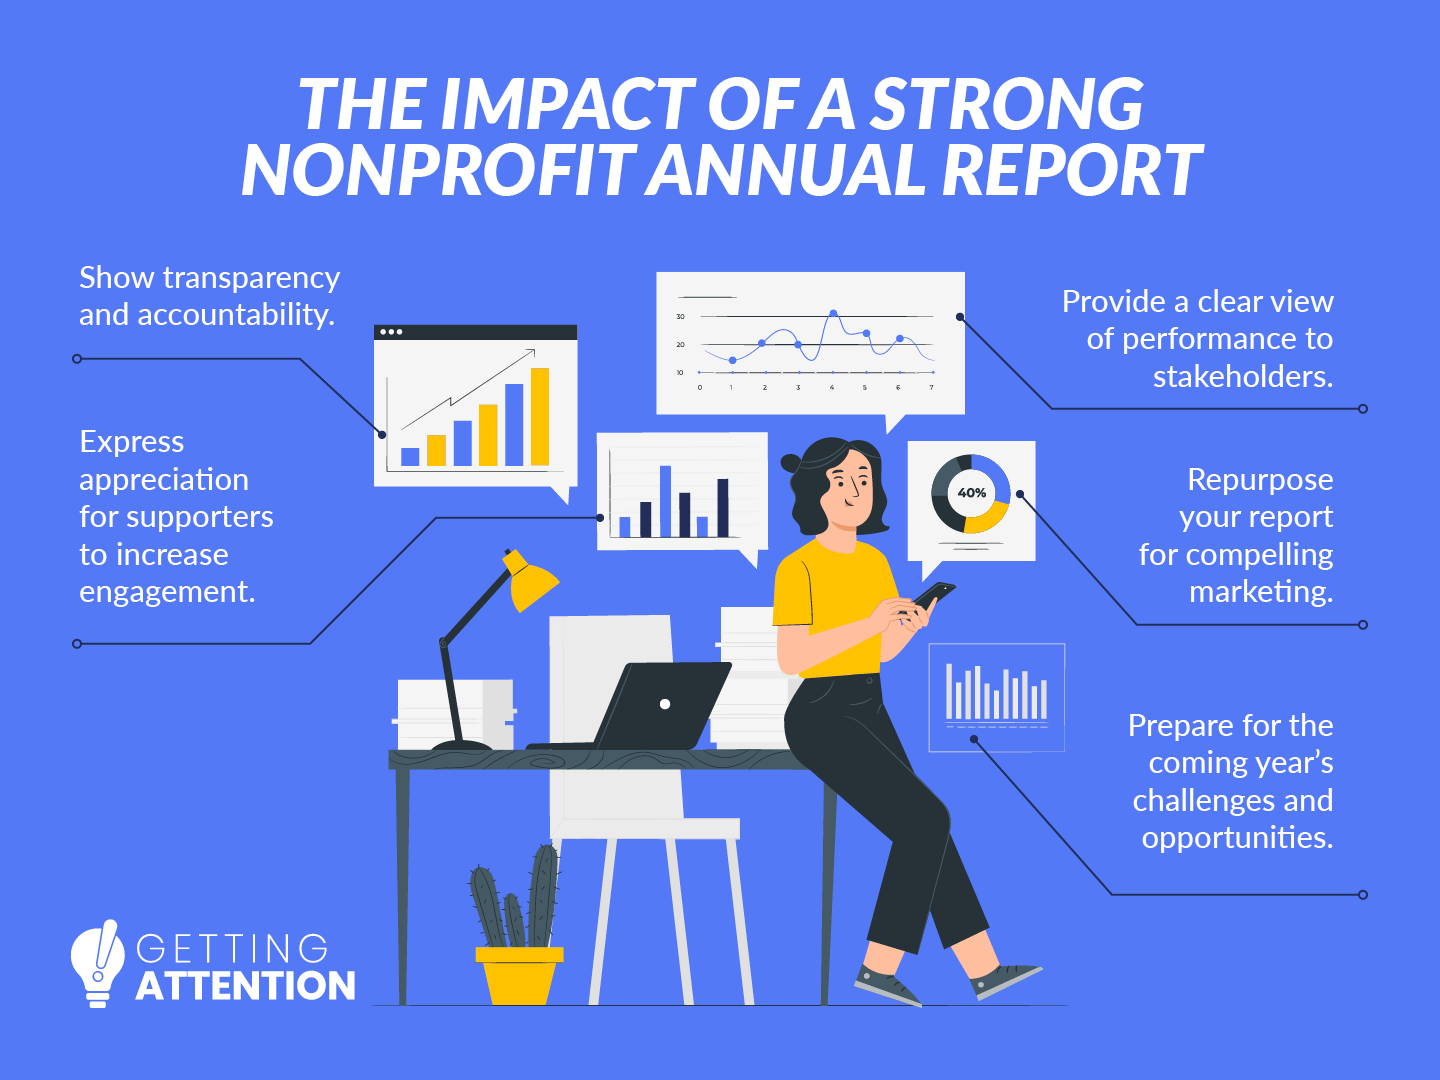
- Increased transparency and accountability. Annual reports provide clear information about how your organization uses its resources to further its mission. Financial breakdowns, volunteer activities, and program progress indicate that your nonprofit is trustworthy to donors, grantmakers, corporate sponsors, and the public.
- Enhanced supporter engagement opportunities. By highlighting achievements, your annual report shows the value of supporters’ contributions. You can even use your report to thank generous donors and volunteers.
- Clear performance evaluation. By explaining your goals and performance, you’ll communicate strengths and areas for improvement. This helps grantmakers and corporate sponsors see evidence of your nonprofit’s reliability and effectiveness.
- Compelling marketing opportunities. Nonprofit reports create powerful marketing opportunities since they tell your organization’s mission clearly and comprehensively. They tie together your impact, mission, and community contributions so others can better understand your unique purpose.
- Preparation for the coming year. Your report can provide valuable insights to prepare for the coming year. For instance, you might find that you need to reallocate funding to hit a time-sensitive program goal by the end of the following year.
Essentially, your nonprofit annual report can guide your internal decision-making and be marketed externally to promote successes and call supporters to action.
Paper vs. Digital Annual Reports for Nonprofits
The format of your nonprofit annual report will depend on your organization’s size and engagement goals. For instance, a smaller nonprofit may use a PDF one-page report for stakeholders to download and print. On the other hand, a more established nonprofit should consider a digital format to make their report interactive and shareable.
The best approach? Offer both a printable PDF and fully digital version of your nonprofit annual report. This strategy lets you accommodate different preferences. You can print or email the PDF version for supporters to print themselves. That way, you can still link to in-depth information, such as detailed financial stewardship data.
Meanwhile, an interactive web page for your annual report can provide a dynamic multimedia experience. You can engage readers by including branded videos, interactive charts, and navigation menus. The digital format also allows you to reach a broader audience by sharing the report via social media, email campaigns, or even digital ads.
By offering both formats, you can cater to your audience’s diverse communication preferences.
What To Include In Your Nonprofit Annual Report
If you look up “nonprofit annual report examples,” you’ll encounter an array of annual reports of different styles, content, formats, and lengths.
The lack of guidelines can make it difficult to know exactly what you should include in your nonprofit annual report. That’s why, to help you get started, we’ve pinpointed a few key elements you should consider incorporating.
This free nonprofit annual report template consolidates these elements:
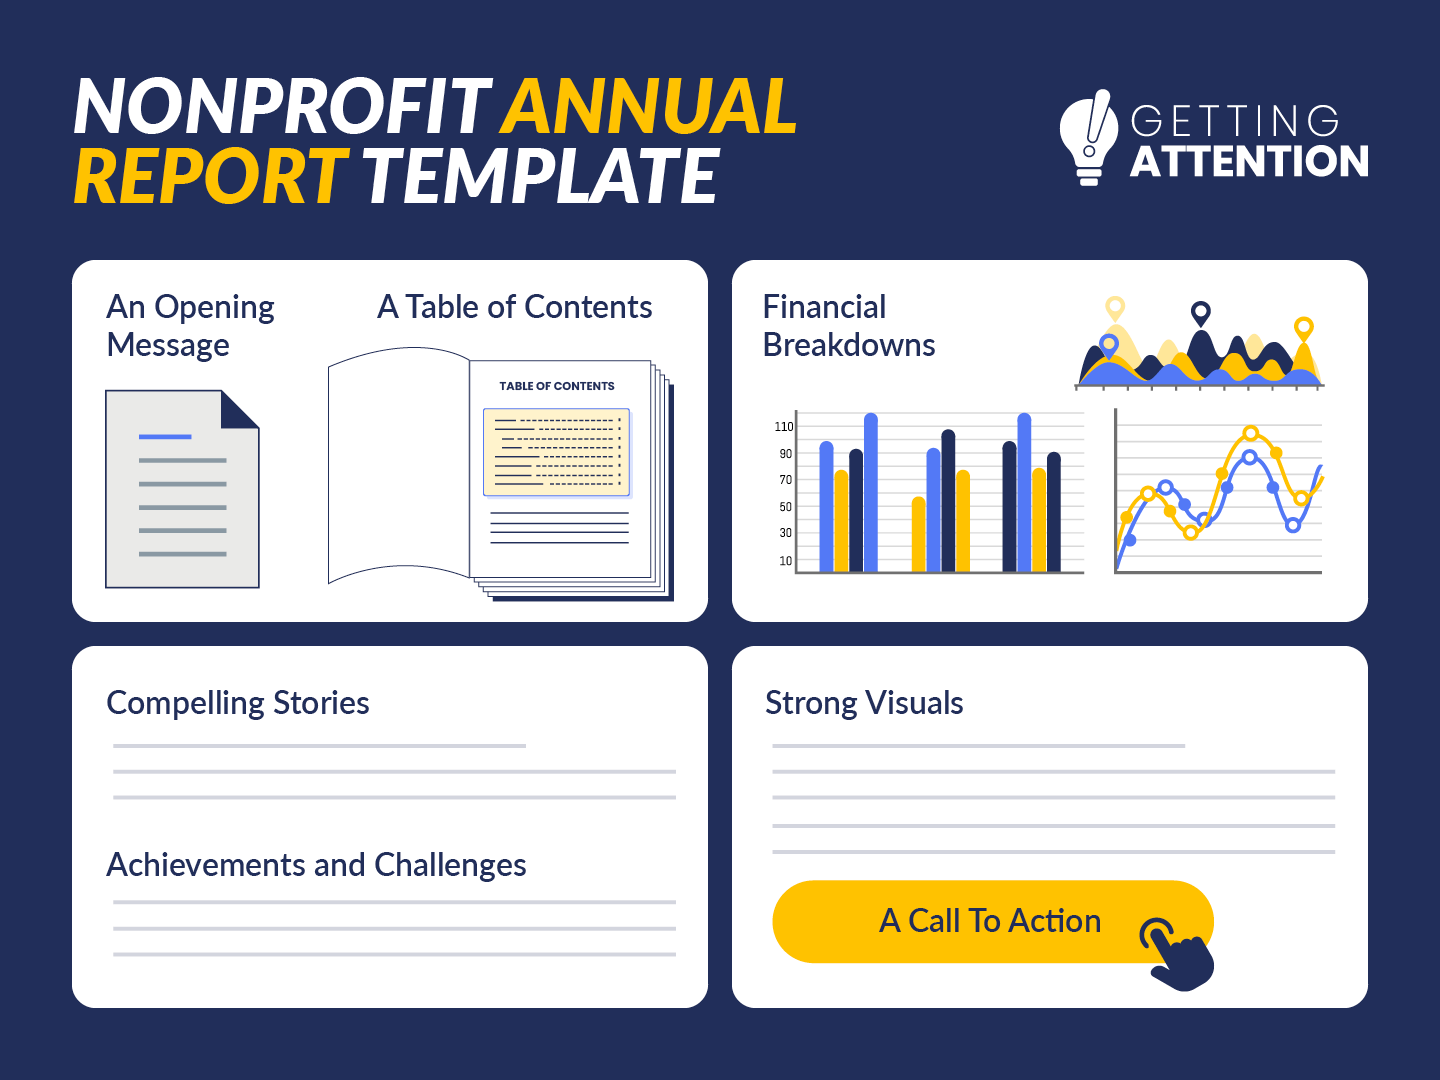
A Short Opening Message From Leadership
Include a short message from your board president or executive director. This introductory note sets the tone for the report, provides context, and gives readers a sense of the organization’s achievements over the past year.
Start with a friendly greeting, like “Dear Friends.” You don’t need to spell out each audience.
Then, keep your letter short, meaning half of a page or 200-300 words. Short is not asking your graphic designer to “make it fit,” leaving audiences to squint at six-point font. Assume your reader is scanning, so hit the high points.
Don’t be afraid to let some personality shine through either. Conveying the director’s sincere excitement about a particular accomplishment, his or her sense of humor, or a personal note makes the whole report more engaging.
If you feel like this letter is your one chance to say everything to everyone– revisit your communications plan. That feeling, and the resulting letter that goes on forever, could be a clue that you’re not regularly communicating with constituents the rest of the year.
A Table of Contents
Create an accessible table of contents to organize your report and provide easy access to sections. A well-structured table of contents guides readers through the report and highlights key sections that may be of particular interest, such as financial summaries or program impact. That way, readers can find specific information without having to navigate the entire document.
Powerful Visuals
Including visuals in your nonprofit annual report conveys information in an engaging way. For example, charts can breathe life into otherwise mundane financial information, and photos of beneficiaries alongside stories can drive emotional connections.
Here are some effective visuals to include:
- Infographics, Charts, and Graphs: Use these visuals to present key statistics, financial summaries, donor contributions, or program outcomes in a digestible format. According to HubSpot’s Visual Content Marketing Statistics, about 30% of marketers use infographics for this purpose.
- Images of Programs and People: Showcase your nonprofit’s impact through high-quality photos of your programs, events, beneficiaries, and volunteers. Include staff, board members, or partners to recognize those who work on the ground.
- Maps: If your organization operates in multiple locations, include maps to highlight the areas you serve, helping readers visualize the scope of your work.
- Timeline of Milestones: Create a visual timeline to illustrate significant achievements or events, showing progress and key moments in a chronological layout.
- Videos: For digital nonprofit annual reports, embed short videos to share personal stories or footage from impactful projects.
If you don’t have an in-house designer, outsource the graphic design work to a professional designer. They can ensure that your visuals are polished and aligned with your brand’s message.
Experienced designers like our friends at Kwala understand how to effectively present data and images in a cohesive, impactful report that resonates with your audience. Investing in professional design can elevate your report, making it more visually engaging.
Financial Breakdowns
A nonprofit annual report is the perfect opportunity to share comprehensive financial information with stakeholders. Include the following:
- Statement of Financial Position: Provide an overview of your organization’s assets and liabilities to give a snapshot of its financial health.
- Expense Allocation Graph: Show administrative costs, fundraising expenses, and how funds are distributed across programs to give insight into resource management.
- Sources of Support Documentation: Include details about income streams, such as grants, individual donations, corporate contributions, or revenue earned from services, to highlight your nonprofit’s financial sustainability.
- Major Fundraising Campaigns: Feature key fundraising efforts from the year, including goals, achievements, and the impact of the funds raised on your programs.
- Corporate Sponsorships: Recognize corporate partners who provided significant support, and demonstrate how their contributions helped advance your mission. Considering that companies donate $20-26 billion annually, you want to show your sponsors that you value their support.
Aim for transparency and acknowledge major sources of support. Remember, visuals like graphs and charts can effectively communicate this information. Some organizations also list major donors to publicly recognize their biggest supporters.
Achievements
Including achievements in your annual report showcases the impact of your programs and projects over the past year. Highlight key milestones and success stories from both new and ongoing initiatives, such as volunteer efforts and beneficiary programs. Sharing these accomplishments not only celebrates your organization’s successes but also reinforces your mission’s value to stakeholders.
Challenges
You can highlight the good while still being honest about areas you know need addressing. Your donors and other supporters want to know that you’re working to improve and that their time and money isn’t being wasted.
Even if you had a great year, acknowledge other organizations’ challenges. Otherwise, you miss the opportunity to show camaraderie and gratitude. Phrases such as “In spite of difficult economic times, we were fortunate to… ” can go a long way.
You can also bring up anticipated challenges for the upcoming year, indicating a need for increased support.
Compelling Testimonials and Stories
People remember stories 22 times more than facts alone. Bring your data to life with compelling stories from beneficiaries, volunteers, and staff members. For example, instead of just stating that 500 meals were provided to families in need, share the story of a single mother who received those meals. Explain how it eased her burden and allowed her to focus on caring for her children.
A Call To Action
Hint at a few things you’re excited about for the coming year. Keep your ending hopeful but not artificial, and invite readers to do something, like:
- Follow your nonprofit on social media
- Sign up for your newsletter
- Donate before the year ends
- Volunteer at an event
Anyone who reads your annual report is interested in your cause, so tell them how to get involved in supporting you.
How To Share Your Nonprofit Annual Report
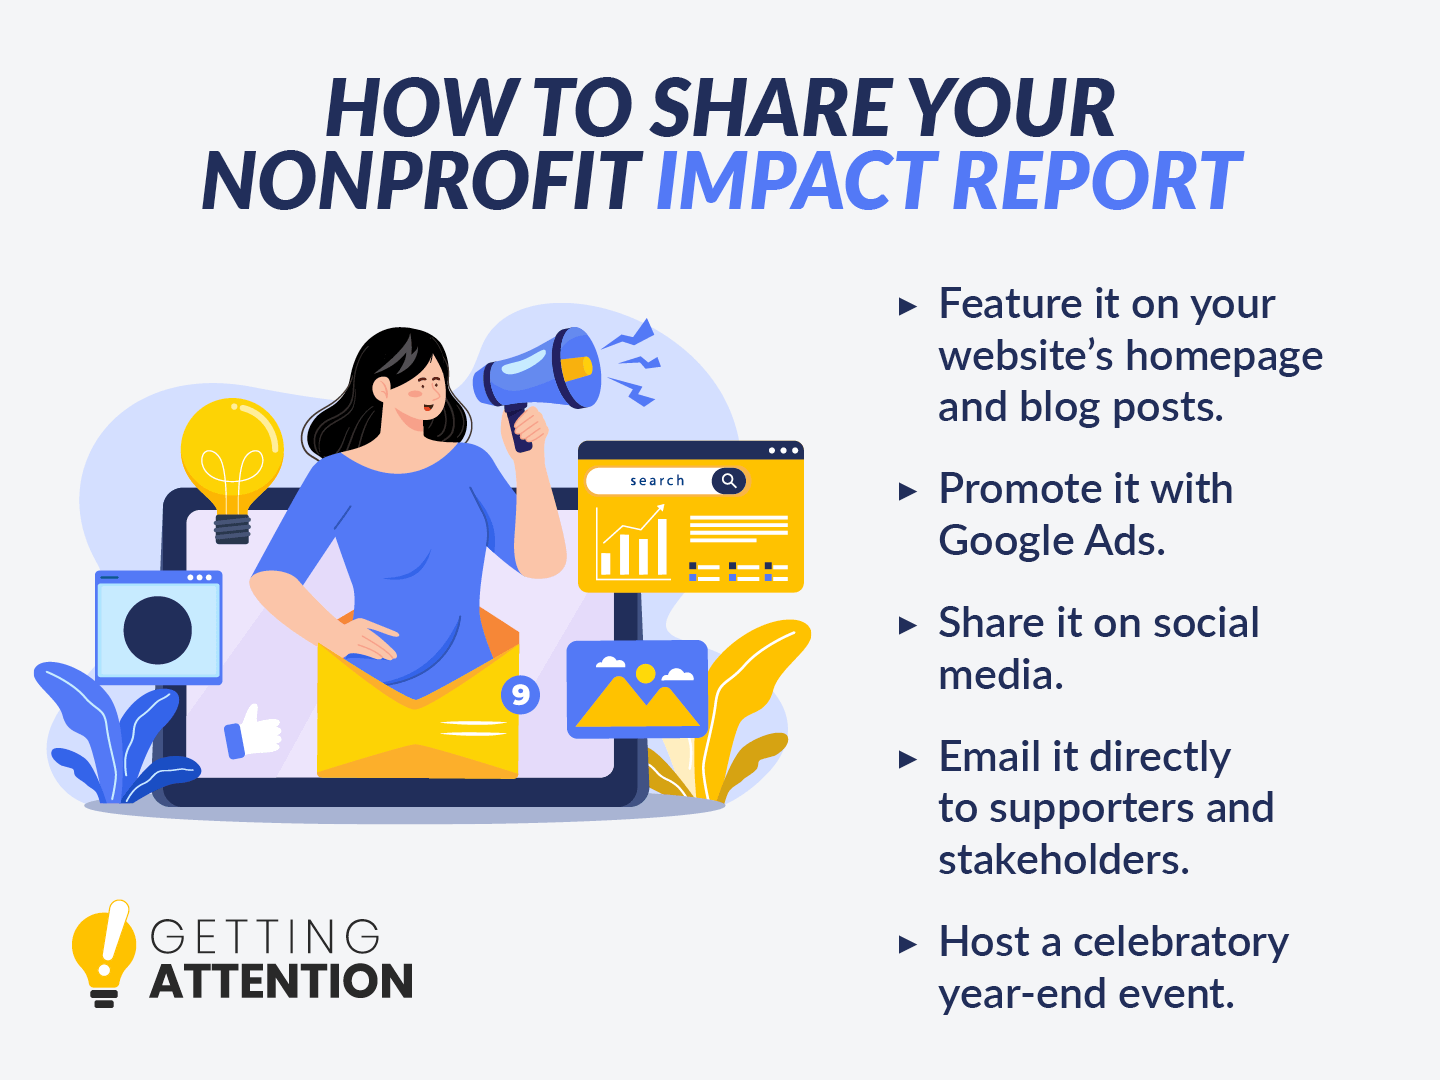
You’ve created the perfect nonprofit annual report—what’s next? Spread the word through effective promotion! Deliver your report with a multi-channel marketing strategy. Leverage these key marketing channels:
Your Nonprofit’s Website
Add a banner or prominent link on your homepage to encourage visitors to check out your new report. Then, highlight key insights from your annual report within blog content to update anyone researching your mission. Link to the full report in your article and promote your blog post across different channels.
Google Ads
Did you know Google owns over 91% of the global search engine market? Google Ads can skyrocket content from your website (like your nonprofit’s annual report) to the top of search results, connecting you with your supporters. Although advertising can be expensive, eligible nonprofits can take advantage of the Google Ad Grants program, which provides $10,000 in monthly ad credits for free.
Our Google Ad Grant agency can help your nonprofit maximize the value of the grant by optimizing keyword strategies and creating ad campaigns that promote your most important content. Our expertise drives more qualified traffic to content like your annual report and donation form, increasing visibility without straining your resources.
Social Media
Fundraising research shows that 32% of donors are most inspired to give via social media, making these platforms ideal for sharing your nonprofit annual report. Share teasers, testimonials, and research from the report to pique your followers’ interest leading up to and following your report’s release.
Here’s how we recommend leveraging each platform’s unique features:
- Facebook: Using your nonprofit’s Facebook page, share the full report link, highlight key sections with engaging visuals, and encourage sharing.
- Instagram: Use photos, videos, Stories, and Reels to showcase program highlights and add a report link in your nonprofit’s Instagram bio.
- LinkedIn: Focus on professional audiences by sharing posts about impact, financial transparency, and major achievements with links to the full report.
- X/Twitter: Post bite-sized highlights or stats with a link to the report, using a series of posts to build anticipation.
- YouTube: Create a summary video with testimonials, visuals, and program footage and link to the full report in your YouTube video’s description.
By playing to each platform’s strengths, you’ll maximize your reach and engagement.
Nonprofit emails generate 28% of all online fundraising revenue, making them effective for sharing your annual report.
Draft emails to highlight your report’s release and importance. This may include individual emails to tease information and announce your impact report’s publication. You can also update a section in your newsletter to highlight the report.
Be sure to segment your email subscribers and send emails directly to relevant stakeholders such as major donors, community partners, or volunteer managers.
Year-End Event
Turn your nonprofit annual report into an opportunity to celebrate your accomplishments with a year-end event. This event can serve as a launch for your insights and a chance to share successes with major donors and key stakeholders. Include a brief presentation highlighting key findings, and take time to express gratitude to the generous supporters who made the past year possible.
Standout Nonprofit Annual Report Examples
Check out these stellar nonprofit annual report examples to spark your creativity. For each example, we’ve highlighted a standout feature you can incorporate into your strategy.
World Wildlife Foundation – Compelling Visuals
The World Wildlife Foundation (WWF)’s visuals make it a great example of a strong nonprofit annual report. Each page highlights different key initiatives, including improving sustainable fisheries, protecting wildlife like rhinos, and safeguarding freshwater resources. For each initiative, there’s a compelling photo that represents WWF’s mission, such as forests, rivers, rhinos, and fishermen.
Most pages also feature a compelling fact or statistic in a larger font to emphasize the organization’s impact and mission urgency, such as “Over 1.4 billion acres targeted for protection by 2023 by WWF and partners through the Enduring Earth collaboration.”
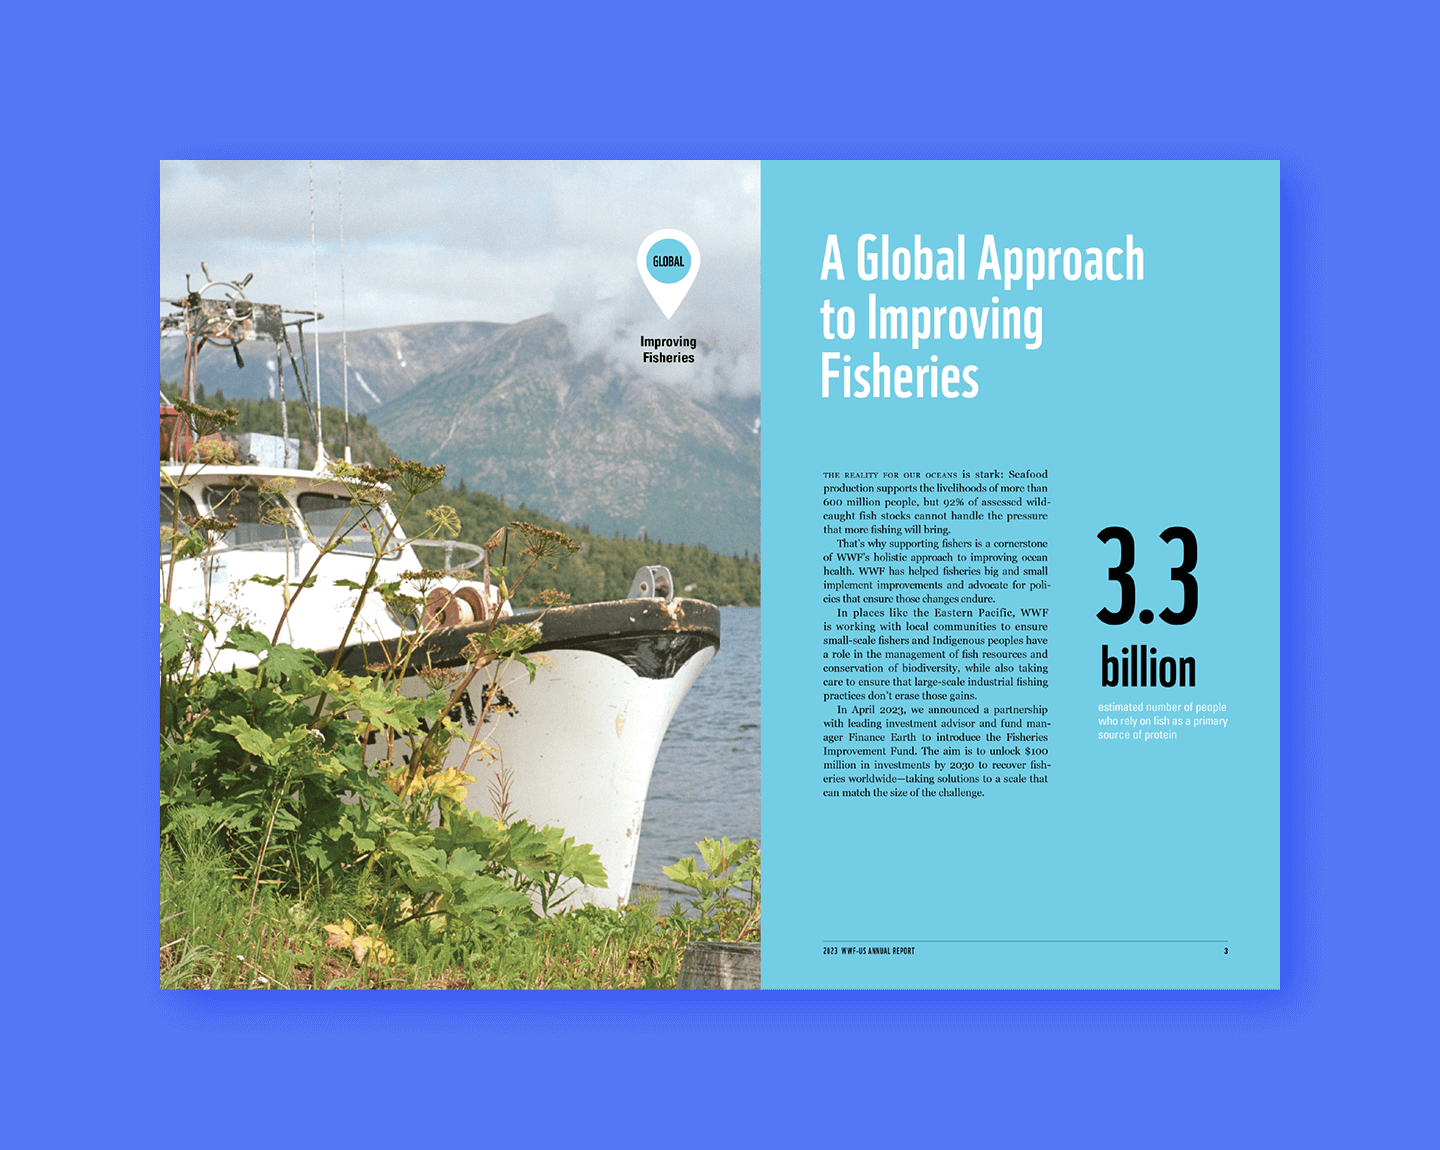
If you click through to the report, notice how it kicks off with a simple cover and opening message. Near the end of the report, take notice of the statement of activities with infographics that explain financial data.
Public Radio Exchange (PRX) – User Experience
PRX, a nonprofit public media company, supports independent producers and organizations by connecting them with supportive audiences. They are aim to bring meaningful storytelling into people’s lives.
Their commitment to user engagement is evident in the impact report’s interactive design. The “choose your own adventure” format allows readers to follow a digital path that resonates with them, whether as networks, creators, or listeners. This innovative approach enhances the user experience by catering to specific interests.
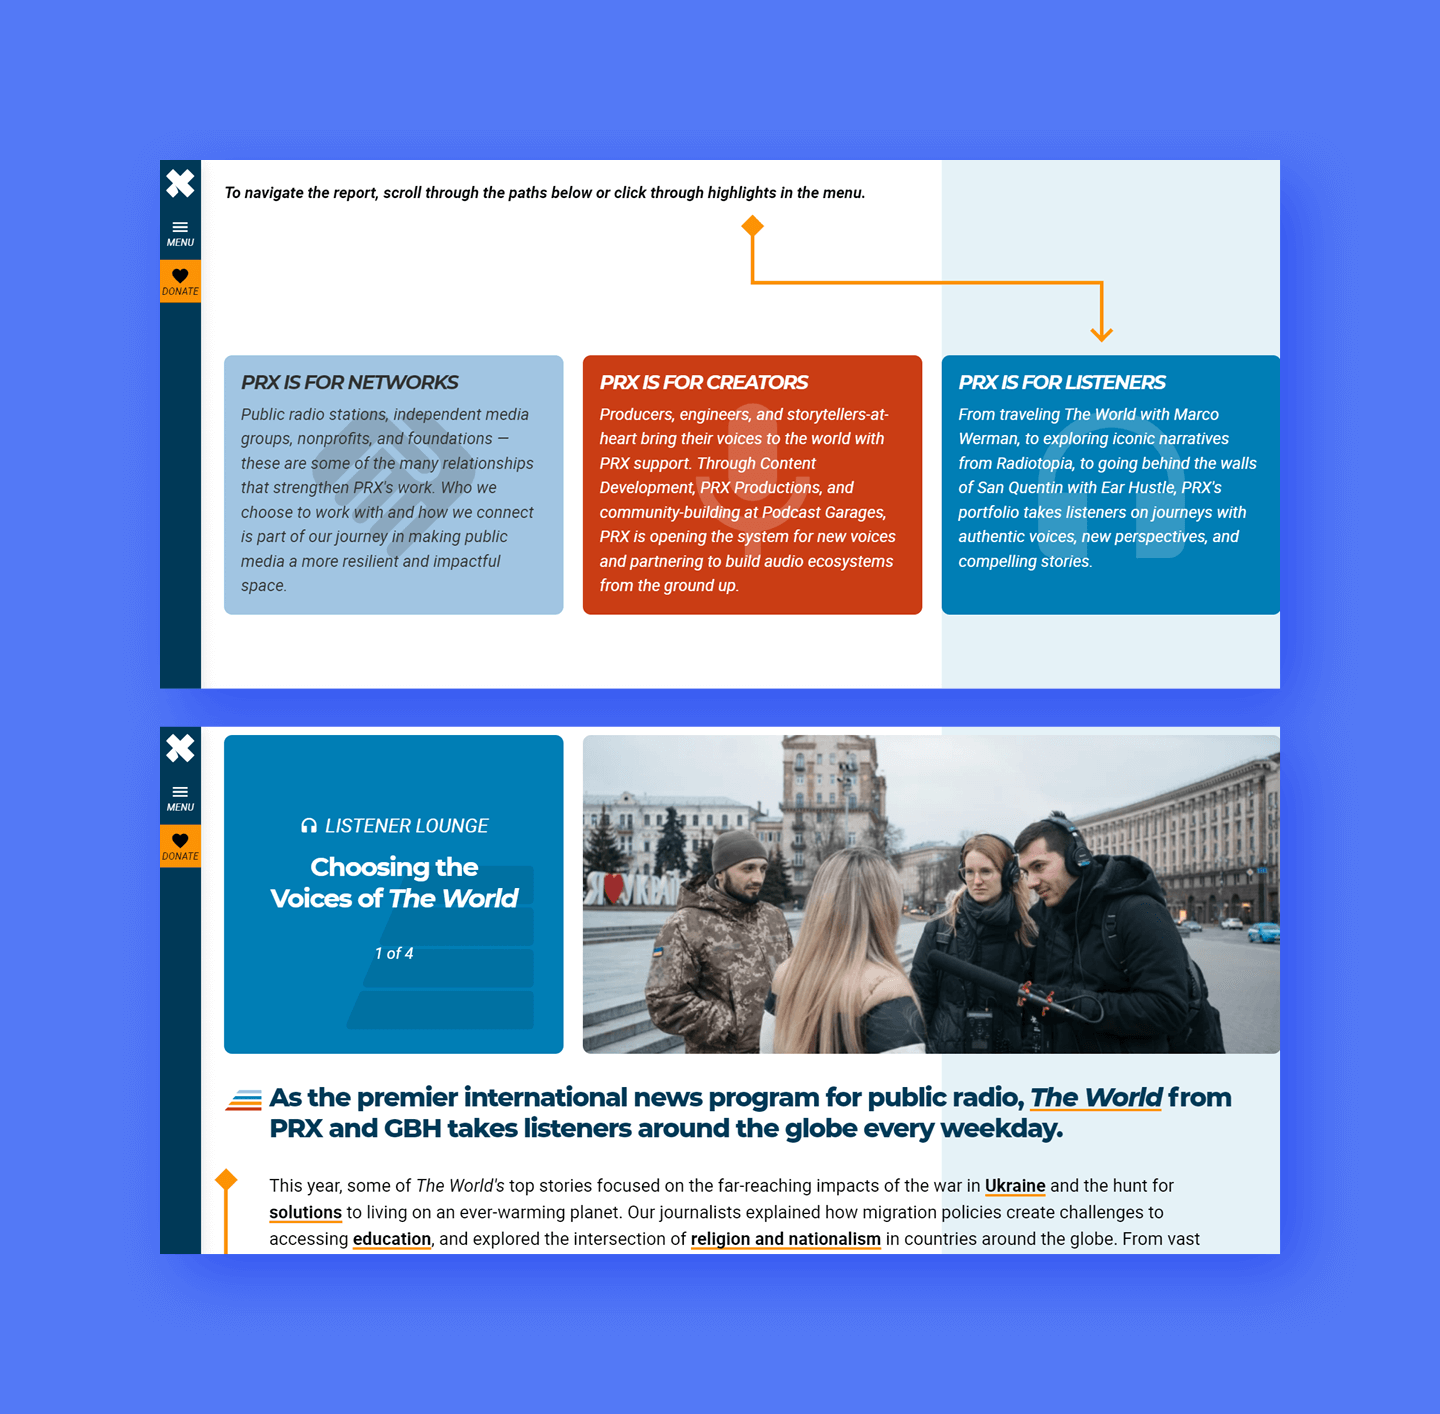
You can achieve a similar effect by segmenting your annual report based on the expectations and interests of your target audience.
CURE International – Storytelling and Digestibility
This nonprofit annual report does a wonderful job of bringing CURE’s impact to life through storytelling. The report features quotes from beneficiaries and impact stories about children like Natnael whose leg mobility was restored by life-changing surgery.
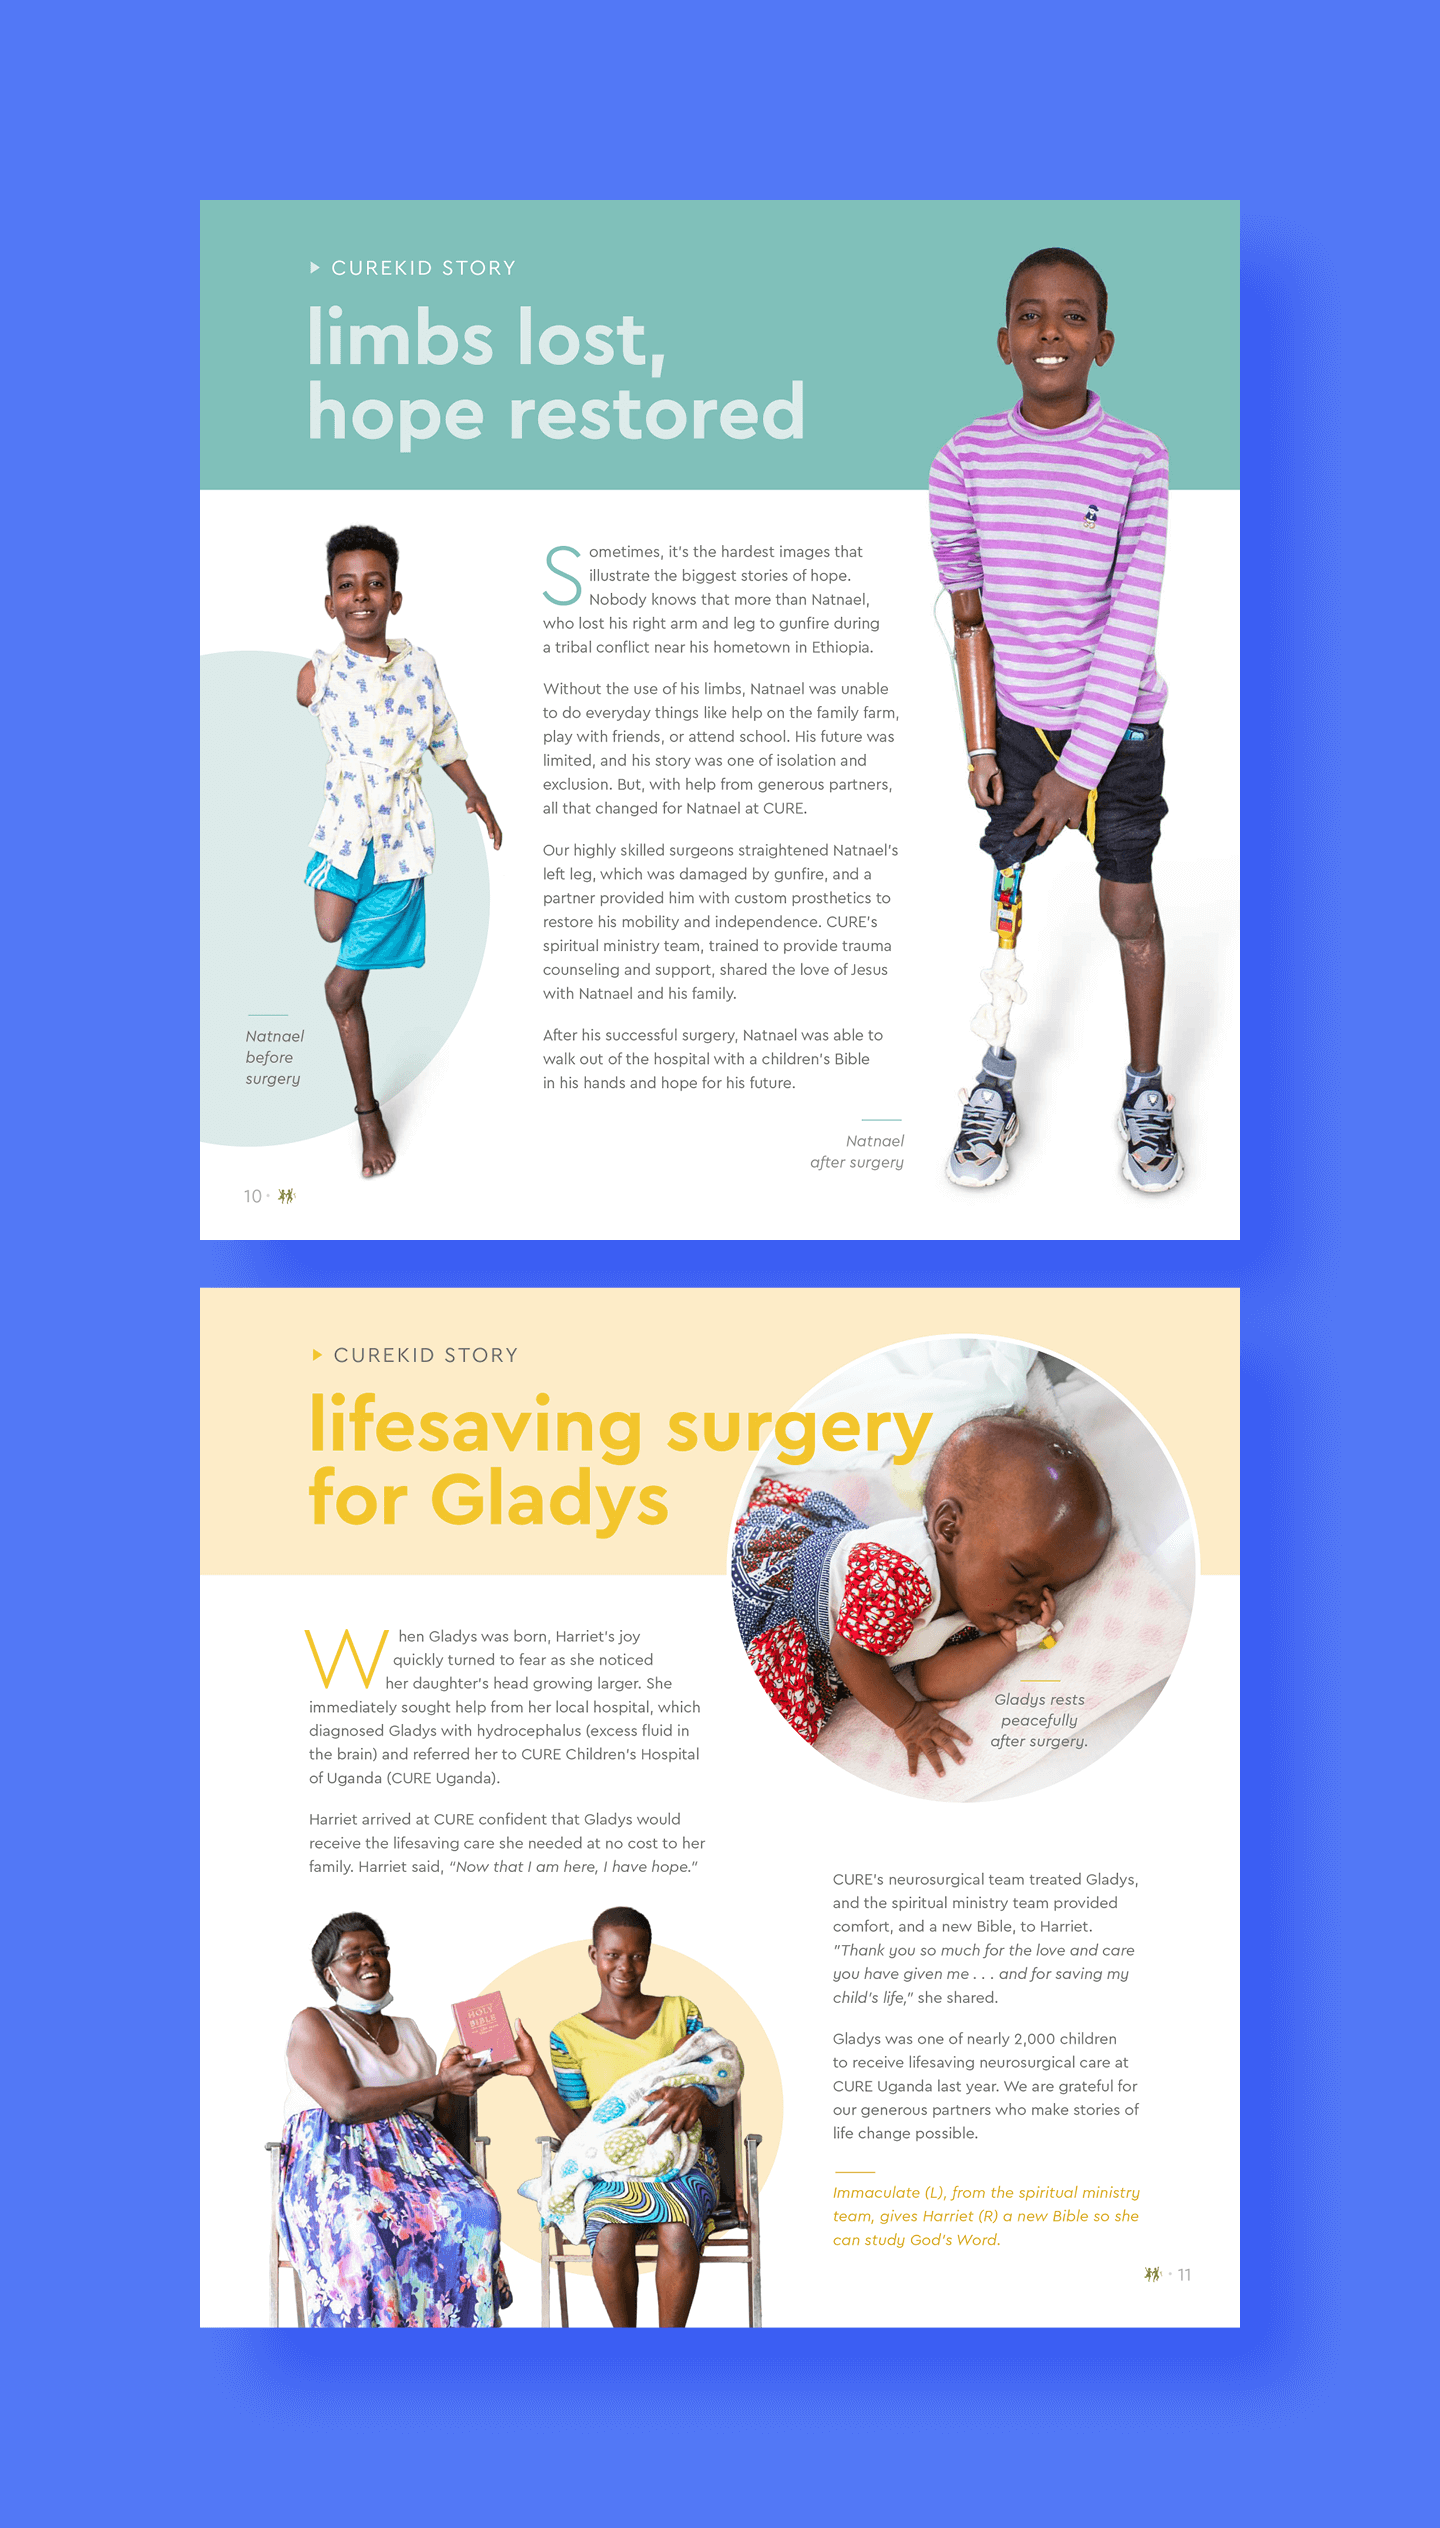
This nonprofit annual report also features compelling images of beneficiaries as well as staff and volunteers in action. All information is presented in a digestible format with bulleted lists highlighting key facts, a map indicating service areas, and infographics breaking down financial data.
Next Steps
Think of your nonprofit’s annual report as more than a summary of the past year; it’s a tool for shaping the future. For executive directors and fundraisers alike, it represents an opportunity to tell your organization’s story and cultivate deeper connections with stakeholders.
By focusing on impact and weaving in authentic narratives, you can turn this document into one of your most effective fundraising and marketing tools. As you start designing your report, check out these resources:


